Google Charts API
Using Google Sheets
Introduction
There are many databases and data sources that can be used with the Google Charts API. These are covered in the Charts API Guide. You can even put the data directly into a web page which how the API examples are written.
Many of the data sources can be referenced through the Google Visualization API Query Language or otherwise imported through JSON (JavaScript Object Notation).
For some, including me, getting an IT department to approve, create, secure and maintain a "real" database turned into a hassle so I started using Google Sheets as the data source for my work and hobby sites. The Charts API documentation has a page for using them and they are easy to maintain.
Using Google Sheets
The Google Sheet the data is coming from must be shared so that "Anyone on the internet with this link can view" it. If this is not done the page code cannot access it. There are methods to require an access token using OAuth for greater security. I do not use that method as there's nothing in the Sheets I use that need to be kept secret and I just download them now and then to back them up "just in case."
Google Sheets are easy to use and the data updated as soon as the browser is refreshed. It doesn't even matter what order the columns are in or how the rows are sorted as that can be specified in the queryString as the data is being imported or even when the chart or table is being drawn.
Once decided on, changing the order or adding more of the columns is going to affect the visualization's data table causing the need to change the code to reflect that. This is true of any data source so is not a special problem to using Google Sheets.
One problem is that the web pages cannot be viewed locally, ie, directly from the file system in a browser. What happens is that the charts will not show and the developer console, accessed by by pressing F12 in most browsers, will show a lot errors such as "No 'Access-Control-Allow-Origin'." This is caused by a CORS (Cross-Origin Resource Sharing) restriction designed to stop potentially harmful cross-origin resource requests.
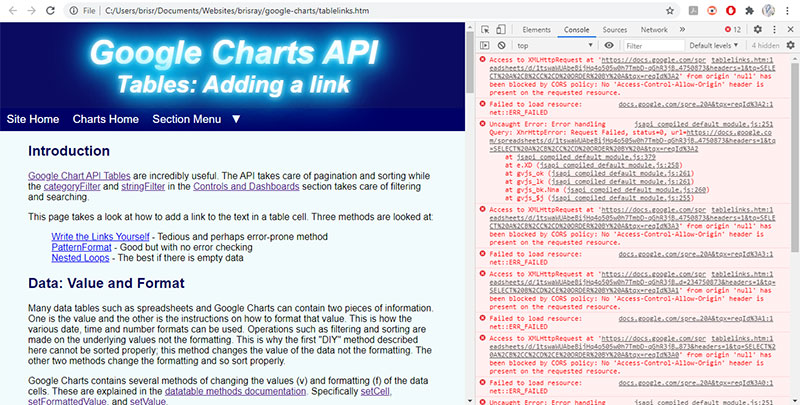
CORS errors on a local browser
There are ways to prevent this from happening and some HTML editors, such as Adobe Dreamweaver, offer a "live" view of the page where this does not happen.
View the Google Sheet used for this section of the website.
Embedding Excel or Sheets Tables and Charts
There is another method of showing tables and charts from Google Sheets or Excel on a web page and that is to use embedding. Articles such as Embedding Google Charts Into Your Website by Kyle Schebor and How to Embed Excel in HTML and in WordPress by wpDataTables show how to do this.